

A data product is a composition of assets that, taken together, deliver a result with business relevance. It captures the end-to-end data lifecycle, and all elements that are involved in creating the product. Dags, tasks, and tables can all be assets of data products.
At Astronomer, we see data products as more than just tables or dashboards. They represent the end-to-end data supply chain: from raw sources through transformations to the final deliverable (a report, dashboard, API, ML model, or analytical dataset). What makes something a data product is the accountability, reliability, and business impact that comes with it, not just the data itself.
In this guide, we use the term data product to describe the complete pipeline, with its input, intermediate processing steps and states and its output. Each element of a data product is referred to as an asset. This should not be confused with Airflow-specific concepts like assets for data-aware scheduling. Think of it this way: a data product is the business concept; assets are an element of it and Airflow assets are one technical mechanism Airflow uses to implement data-aware orchestration within a data product.
From a management perspective, a data product is a measurable business asset with clear ROI and accountability. It’s something you can point to during budget discussions, assign ownership to, and track performance against defined SLAs. Data products make the invisible work of data teams visible by translating technical complexity into business outcomes.
From a data engineering perspective, a data product is a collection of interdependent Dags, tasks, tables and other resources, for a business-critical output and requires coordinated effort across multiple systems and teams to maintain. Data products represent the pipelines worth investing in, where you’ll want proper observability, documentation, and SLA monitoring.
Data products power everything from analytics dashboards and ML models to customer-facing features like dynamic pricing, fraud detection, and personalized recommendations.
When they work, they’re invisible. When they break, everyone notices.
Data teams face a major challenge: much of their most critical work happens behind the scenes. While software engineers ship visible features that users interact with directly, data engineers build the data infrastructure that makes everything else possible. Systems act as a data source for other systems, or decisions are made based on reports powered by the data output of those processes. This can make it difficult to demonstrate value to management and stakeholders.
Like a manufacturing supply chain, that transforms raw materials into finished products, data products rely on a complex web of dependencies across software, systems, tools, and teams. Any failure can have direct impact on revenue, customer satisfaction, and regulatory compliance.
Data products solve this visibility problem by creating a common language between data teams and the business. Instead of explaining we built a 12-stage ETL pipeline with incremental processing and data quality checks, data teams can communicate we built the Customer 360 data product that powers our marketing campaigns. The business understands products. They understand when products break and when they deliver value.
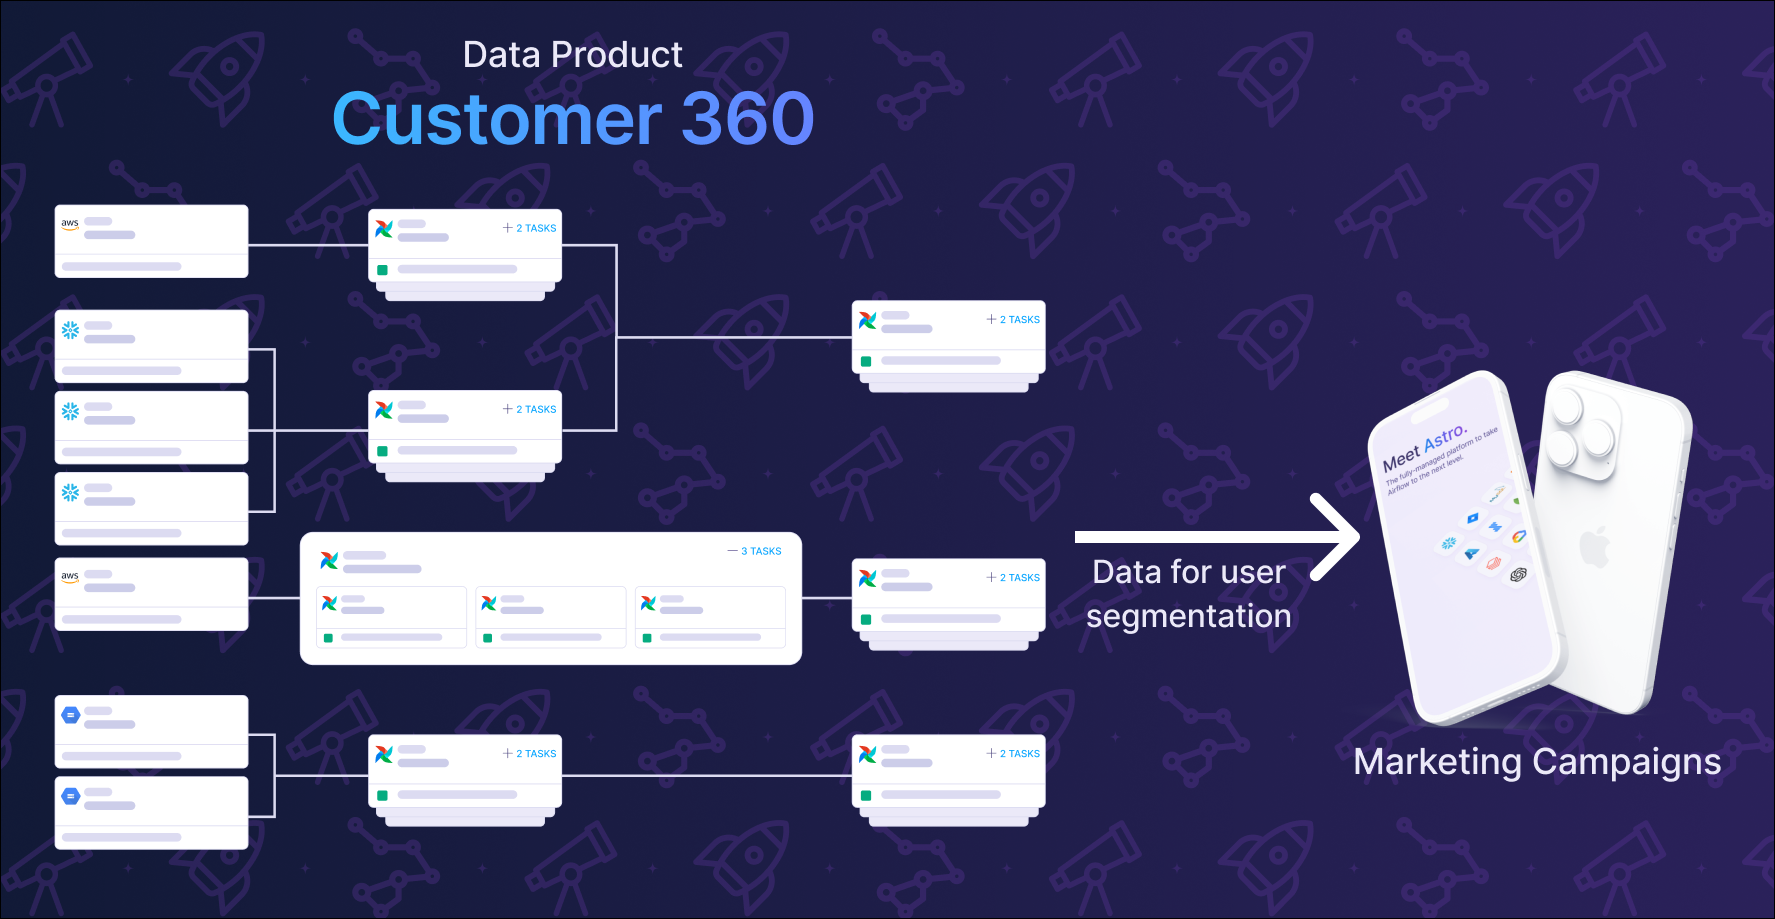
As data architectures grow in complexity, and start to span multiple teams, clouds, and tools, it becomes increasingly difficult to answer critical questions like:
Data products solve these problems by treating critical data assets as managed products with:
Let’s be honest: data product can sound very abstract. Many data engineers prefer more concrete terms when talking with each other: “critical table”, “business-critical pipeline”, or simply “that table that wakes us up in the middle of the night when it breaks”. The terminology matters less than the practices and accountability behind it.
We use data product because it helps communicate with non-technical stakeholders. The analogy with physical products and supply chains maps naturally to data products and data pipelines, making it easier to explain concepts like ownership, SLAs, and quality control to business leaders. More importantly, it helps data teams communicate their value in terms the business understands.
Not every table or Dag deserves to be a data product, yet they might be part of one. Here are three practical patterns that signal you’re looking at a data product candidate:
If it breaks, someone gets paged and money is lost. Failure triggers incidents, impacts revenue, or causes customer complaints. Does this pipeline wake someone up when it fails at 3 AM?
Parent Dags triggering multiple child Dags, pipeline chaining across teams, or complex dependencies using Airflow assets. The orchestration complexity itself signals business criticality.
Critical tables used by multiple teams, feeding executive dashboards, powering ML models, or serving external partners. If this disappeared tomorrow, would executives notice? Would customers be impacted?
Once you’ve identified a potential data product using these patterns, you’re looking at one or more outcomes of this product, like a table or model. The next step is identifying all the involved upstream assets that produce this outcome.
An asset is any component within a data product’s lifecycle, including source data (tables), intermediate transformations (Dags or tasks), files, or final outputs, that contributes to delivering the product’s business value. Assets are the building blocks that, when combined together, create a complete data product.
Once you’ve identified your data product and its assets, the next step is making it visible, observable, and ensuring data quality, timeliness, and freshness through automation.
Here’s the challenge: orchestration alone isn’t enough.
In software development, once you understand requirements and build to spec, the product works predictably. In data projects, you often don’t know about data quality, and concrete attributes like volume and velocity, until you’ve built the product and put real data in front of real users. This fundamental uncertainty affects how you scope work, communicate with stakeholders, and define success.
Orchestration coordinates the interactions and dependencies between source data, tools, compute resources, and teams. But many orchestration tools offer only limited monitoring. It’s not enough to just detect that a task is running at high latency, or a Dag has failed. These may appear as isolated incidents, but one delay often starts a cascade of errors that quickly overwhelms the system and the people maintaining it.
Platform and data engineers spend their time reacting to failures rather than proactively managing data products. Issues are often not detected until the data product is being used (or is missing), by which time it’s too late.
Astro Observe delivers observability built directly into Astro, providing complete pipeline visibility from ingestion through transformation to delivery. Unlike traditional observability tools that stop at the warehouse, Astro Observe gives you end-to-end visibility.
With Astro Observe, you can:
Defining a data product in Astro Observe is straightforward. You identify the critical assets (Dags, tasks, tables) that together deliver business value, assign ownership, set SLAs, and start monitoring. What makes this process particularly convenient in Observe is that it automatically infers upstream assets based on Airflow metadata just by running your Dags.
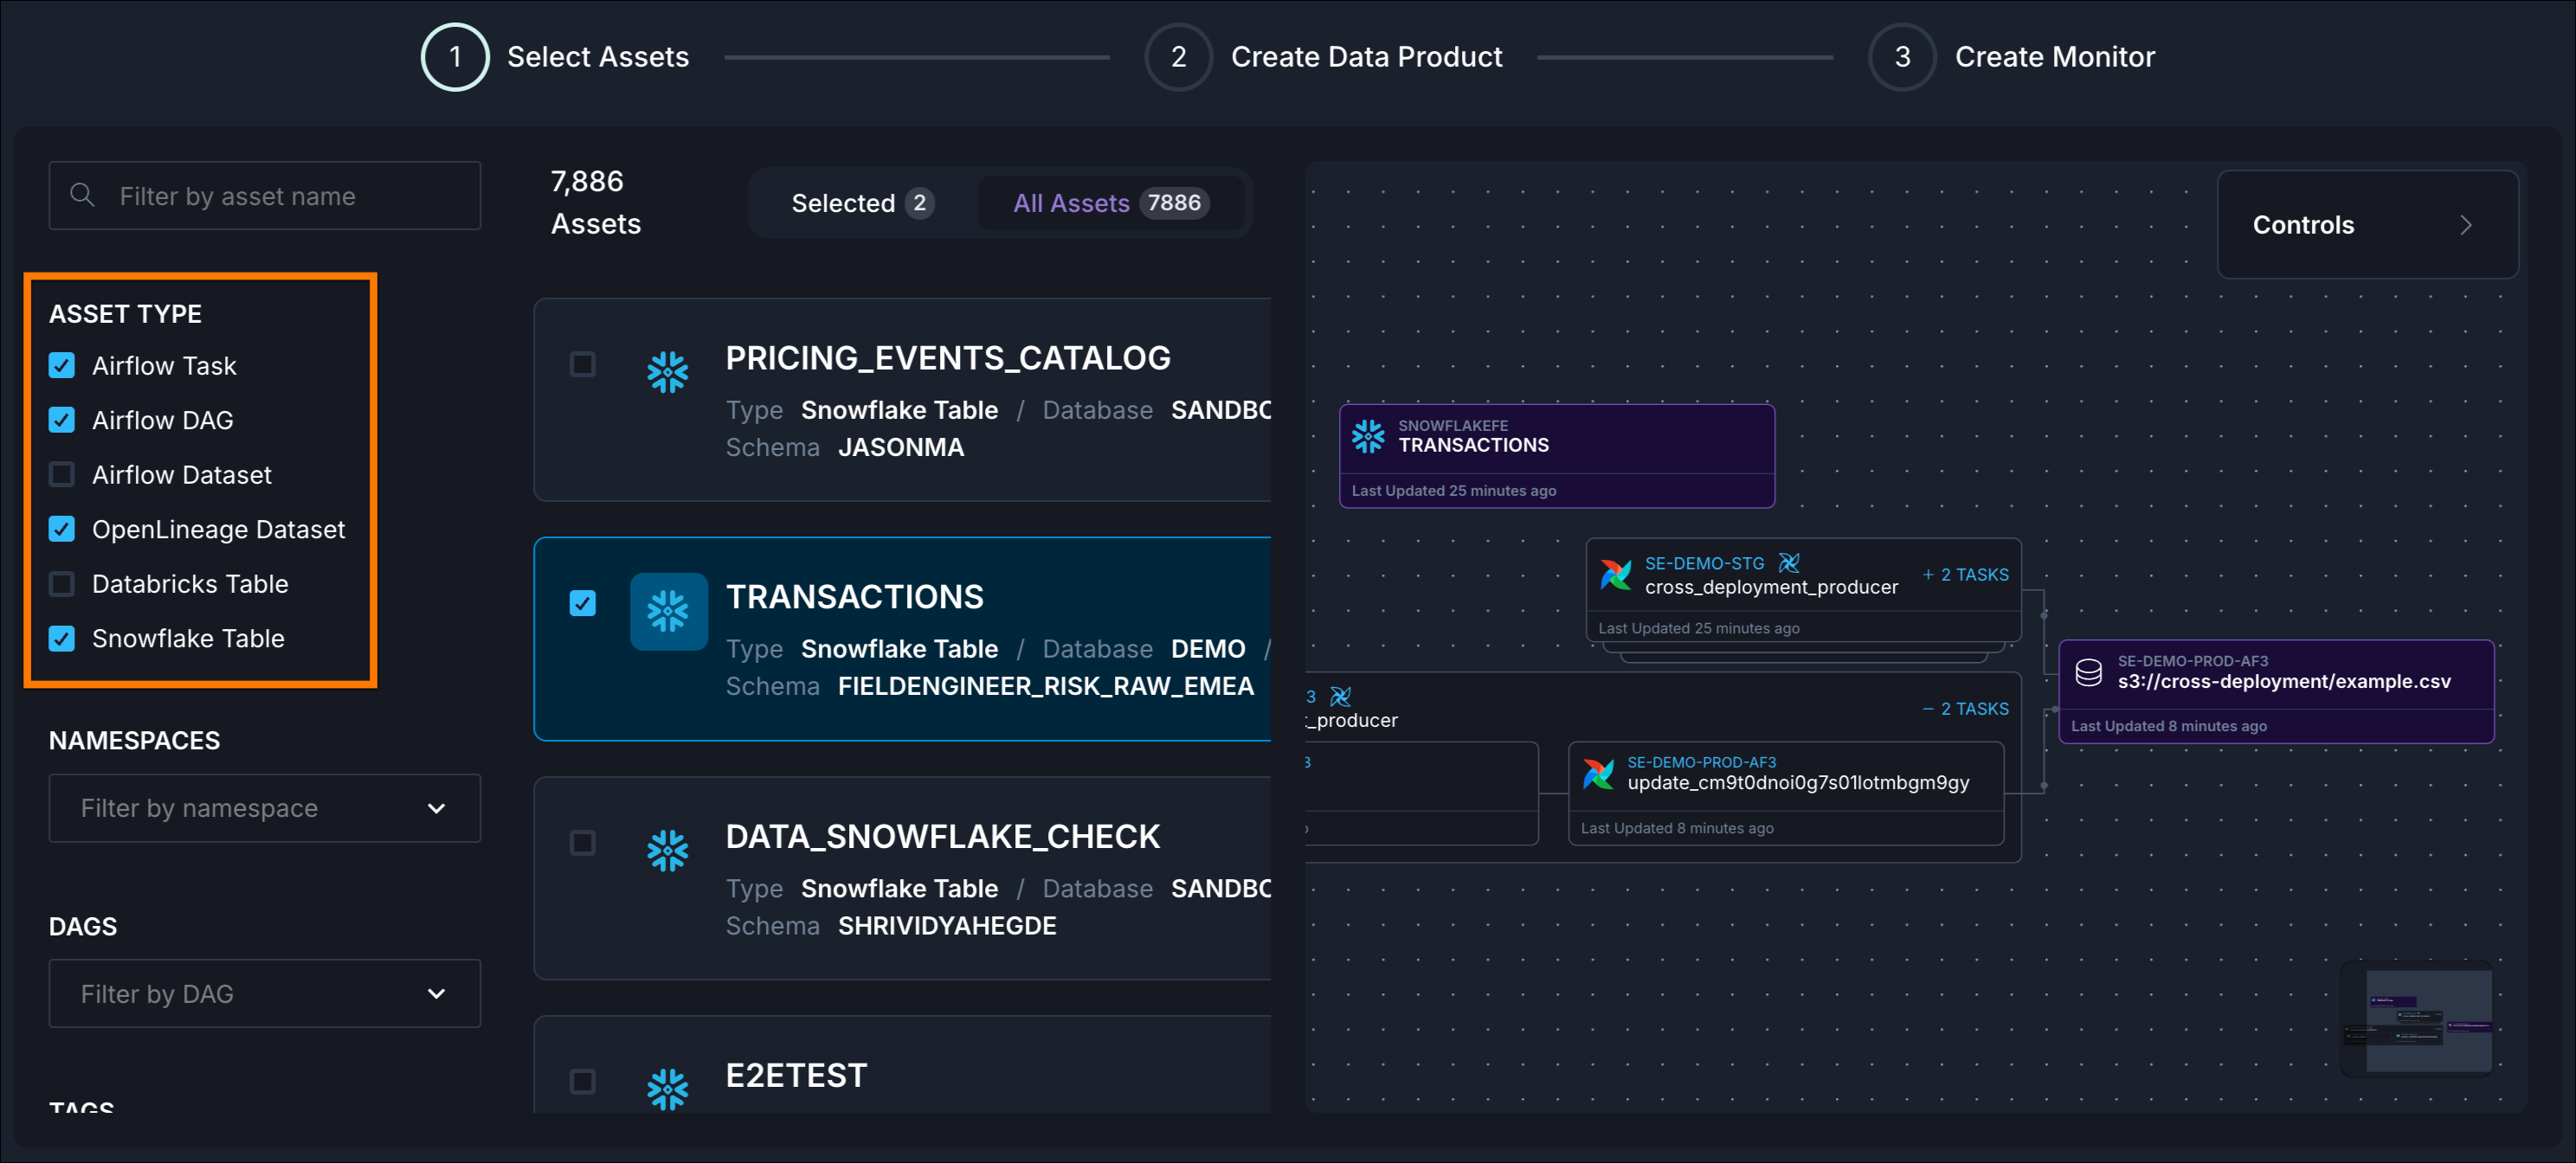
An online betting company must submit daily compliance reports to state gaming commissions detailing all wagers placed, payouts made, and suspicious betting patterns that could indicate problem gambling or match-fixing. Each state has different reporting requirements, formats, and submission deadlines, making this a complex challenge.
Let’s check for the three indicators described above to see if the compliance report should be a data product:
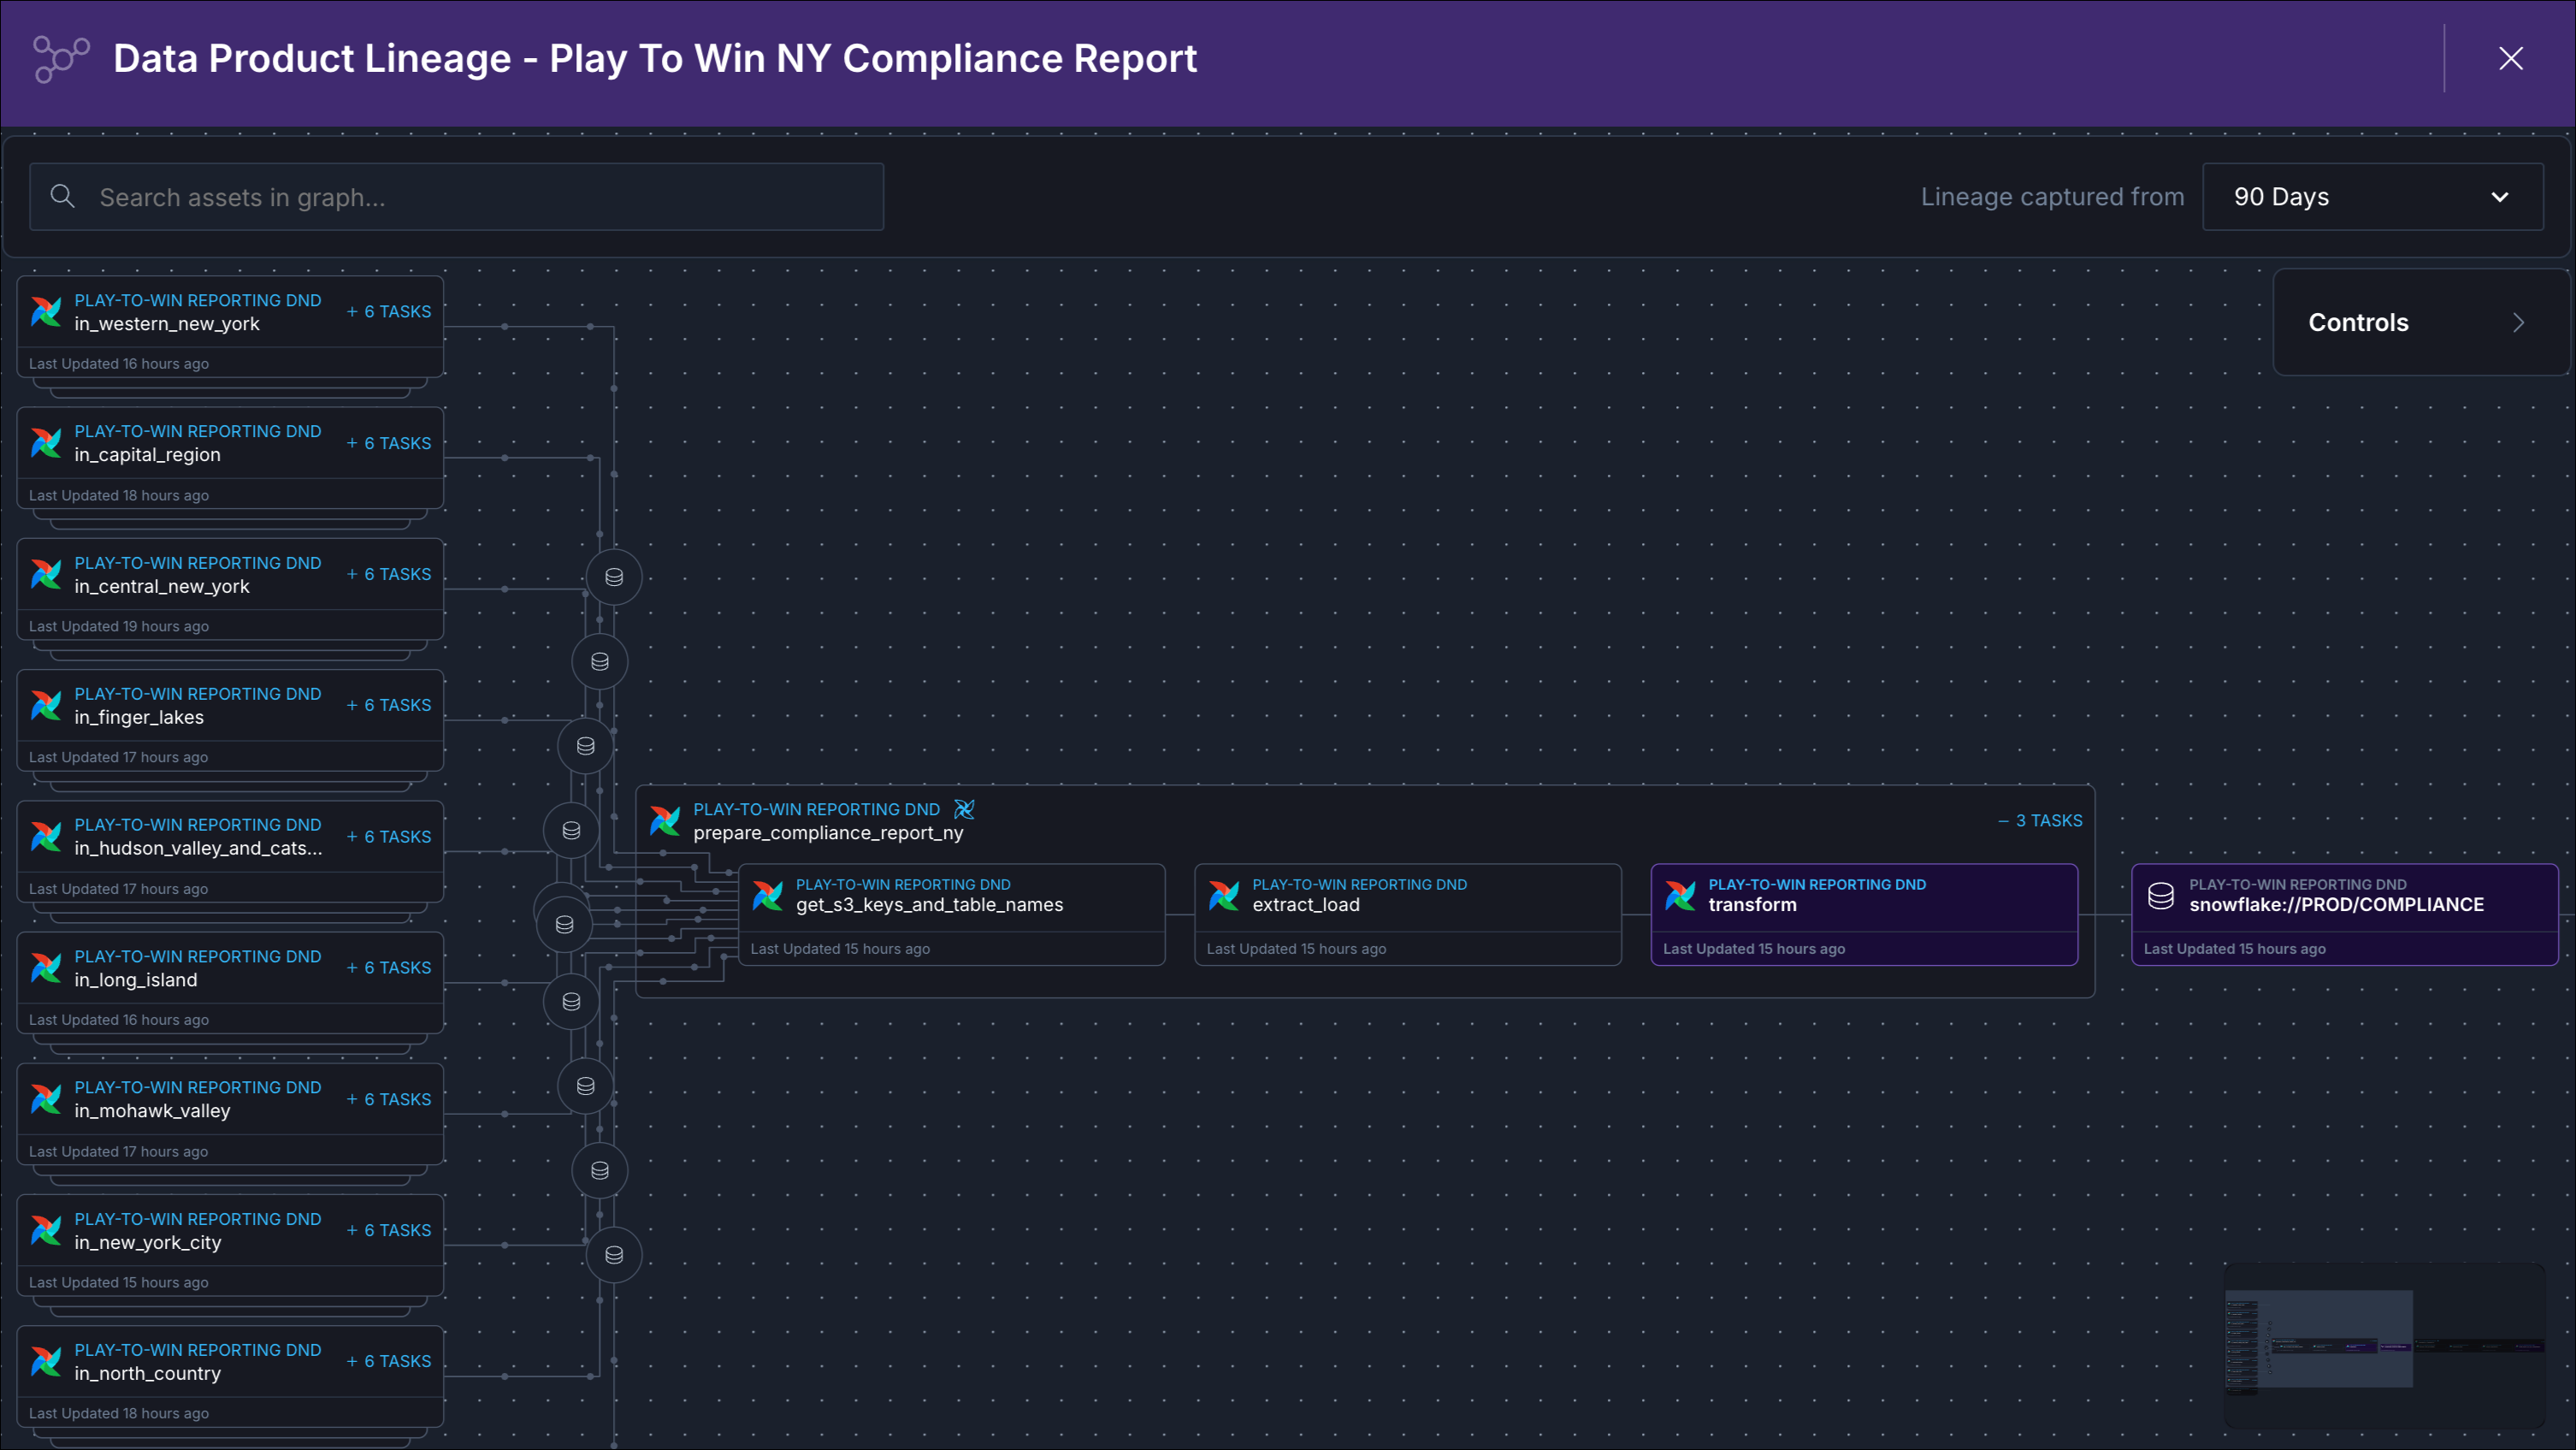
Creating a data product and adding all involved assets in Astro Observe enables visualization and monitoring of the flow of data through the distributed tasks that generate and modify the tables.
In Observe, you see a lineage graph that visualizes the path of the report’s data from all sources through the Dags that extracted, transformed, and loaded the data into the data product.
Each node represents an asset with a unique identifier, the emitting system (Apache Airflow, Snowflake), and the length of time since the asset was last observed.
Now that the data product is identified and configured, it can also be monitored proactively.
Data products help data teams demonstrate ROI. Frame work as maintaining 10 data products supporting $50M in revenue rather than technical tasks.
If pipeline failure wakes someone up, triggers executive escalation, or stops revenue, it’s a data product. Business impact is the goto test for identifying what deserves product-level treatment.
When you see Dags triggering other Dags, Airflow assets coordinating dependencies across teams, or workflows spanning multiple domains, the orchestration complexity itself indicates that there is a data product.
Not every popular table is a data product. Ask: Who notices if it disappeared? Would customers be impacted? Would we lose money? Criticality and accountability matter more than usage alone.
One delay often cascades into multiple failures. Proactive monitoring with SLA tracking, lineage visualization, and proactive alerting catches issues before they impact business outcomes.
Clear ownership ensures someone is responsible for quality, uptime, SLAs, and evolution. It enables faster incident response, better stakeholder communication, and demonstrates who delivers value when products succeed.
Want to see how this works in practice? Book a demo and explore how unified orchestration and observability can transform your data operations.