

Astro Observe uses monitors to continuously assess the health of your data products and pipelines. When a monitor detects a failure, it can automatically alert your team through your notification channels such as email or Slack. Monitors help you rapidly identify and resolve operational issues in your data workflows.
Only one Data Product monitor can be created per data product.
The Proactive Failure Monitor monitors a specific data product and sends an alert when any upstream or final dag in the specified data product fails. This enables you to quickly respond to failures, address the root cause, and understand the downstream impact.
When a monitored failure occurs, the alert:
You will be automatically prompted to create a Proactive Failure Monitor as the fourth step in the Data Product creation process. Configure the monitor by selecting a severity level and notification channel(s) to receive alerts as described in the following steps.
Data quality monitors help you track the health and integrity of your data assets. You can create monitors for tables and columns to detect anomalies in data volume, completeness, and schema changes. To learn more about data quality and configure a connection, see Data Quality.
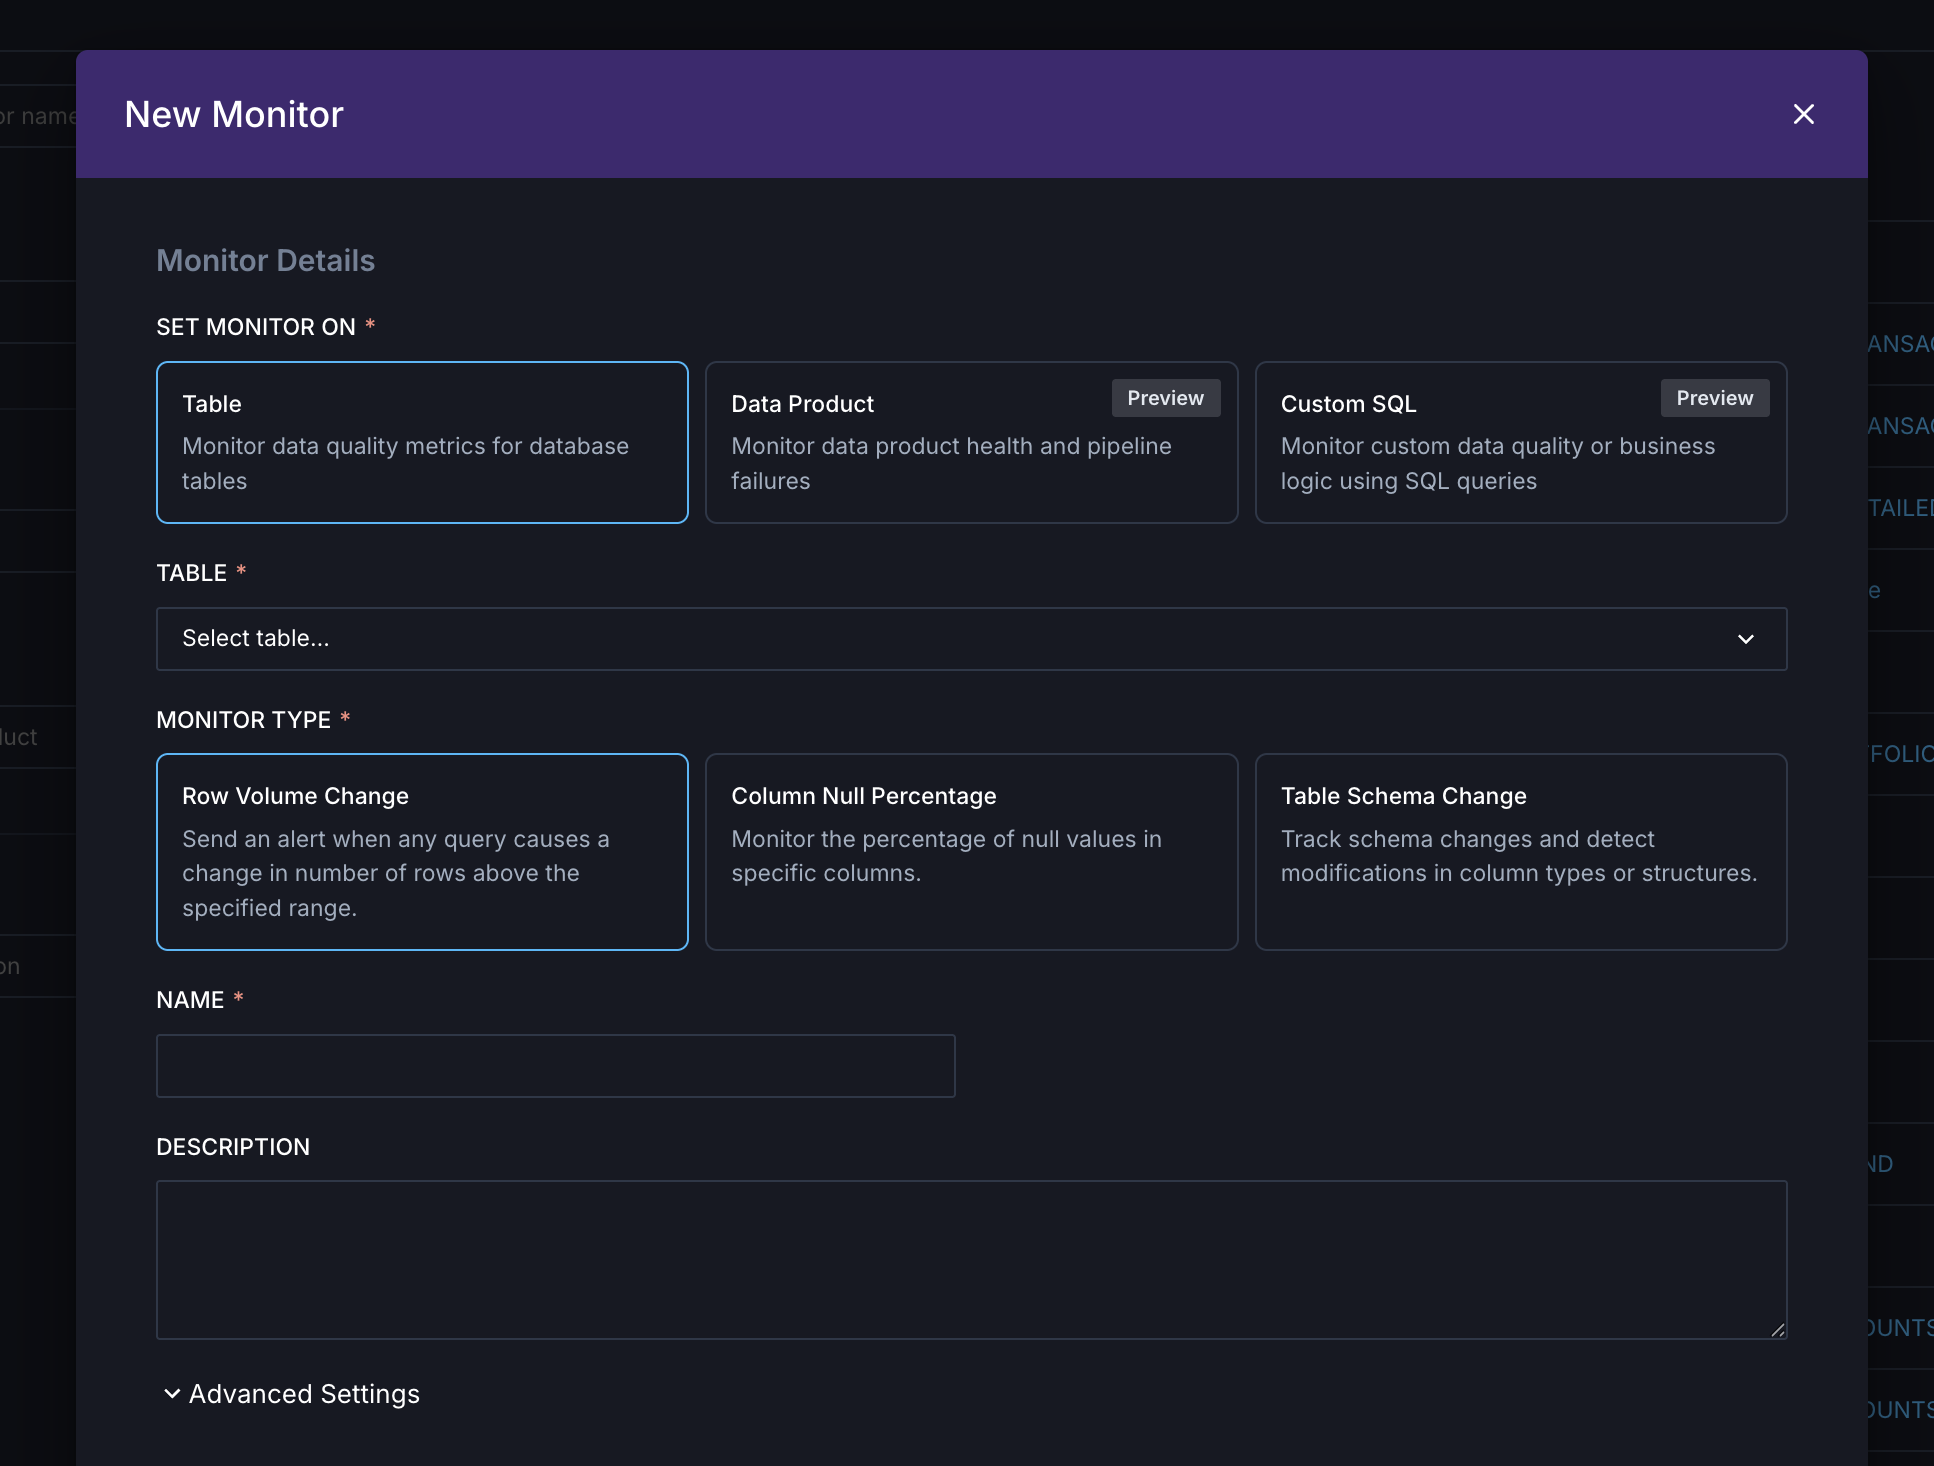
Follow these steps to create a monitor for a table or column.
In the Asset Catalog, find the table you want to monitor. Filter the catalog to the table type you want to see (for example, Snowflake tables).
Tables are sorted by popularity to help you find the most relevant tables to monitor. Popularity rankings are based on query frequency and the number of unique users accessing each table.
The Row Volume Change monitor tracks changes in table row counts over time to identify unexpected fluctuations in data volume.
When configuring this monitor:
The Column Null Percentage monitor tracks the percentage of null values in a specific column to surface completeness problems.
When configuring this monitor:
The Table Schema Change monitor detects when the structure of a table changes, such as when columns are added, removed, or modified. This helps you identify unexpected schema changes that could impact downstream processes.
The Custom SQL monitor compares the numeric output of a SQL query to a defined threshold. Using this monitor, you can define data quality checks specific to your business requirements (for example, checking for missing records, duplicates, broken joins, or invalid values). Custom SQL monitors can be triggered on a set schedule, manually, or programmatically.
When configuring this monitor:
Select the data warehouse connection (for example, Snowflake) that the query will run against.
Write your SQL query. The SQL can query multiple tables and columns but must return one row and one column with a numeric (scalar) value. Example SQL queries are in the section below.
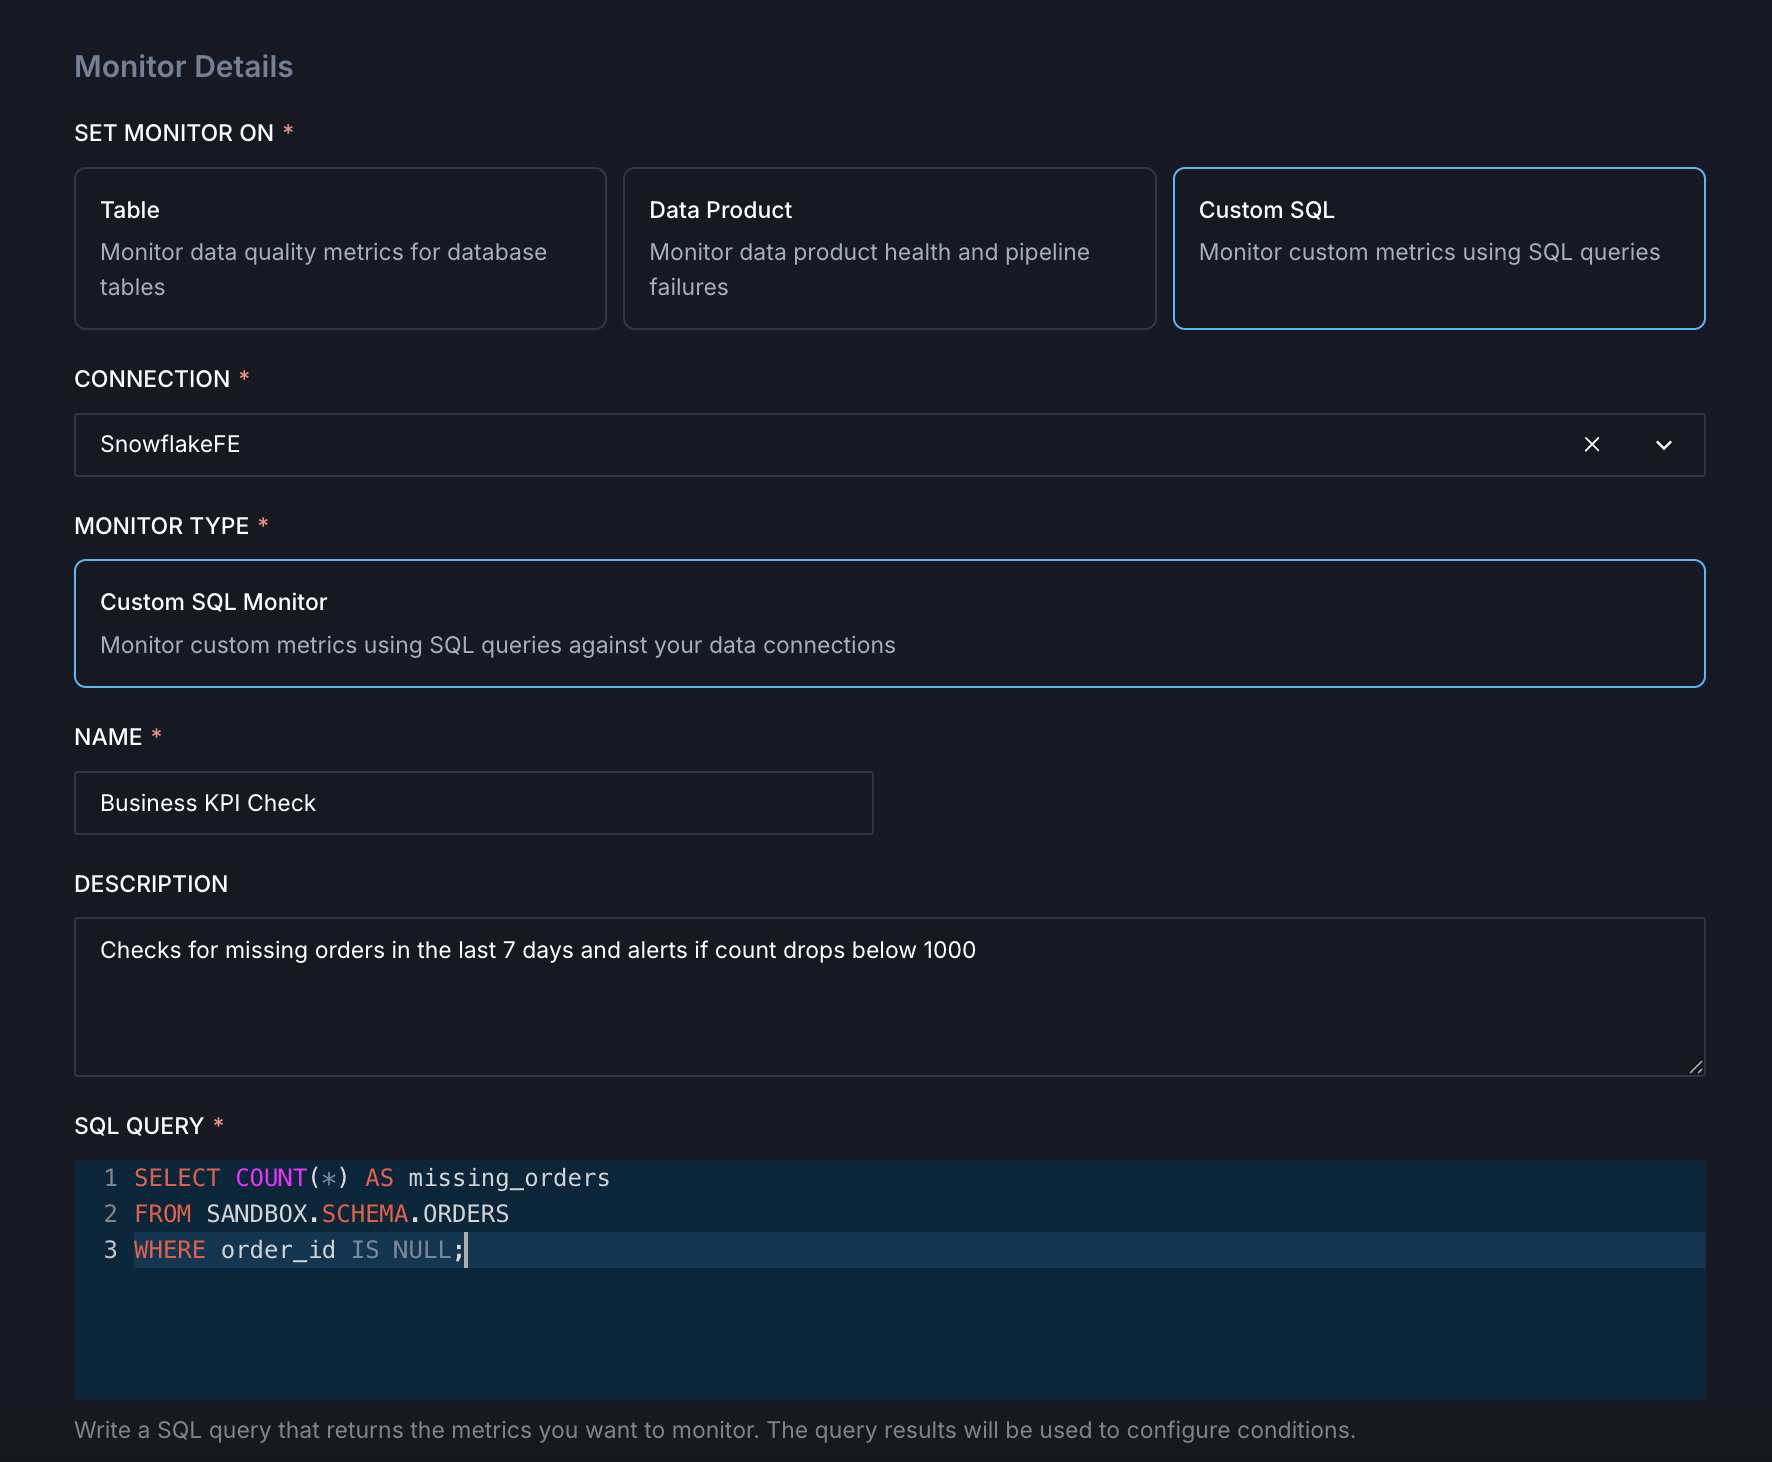
Common use cases include:
In addition to a fixed schedule, Custom SQL monitors can be triggered by events. For example, when a specific Airflow dag completes successfully or when data lands in a Snowflake table. This ensures that checks are evaluated immediately after new data lands, allowing downstream consumers to be notified of data quality issues immediately rather than waiting for the next scheduled check.
You can trigger a Custom SQL monitor by calling the following API endpoint:
When triggered, Observe:
invalid_rows > 0).Example: Airflow DAG trigger
You can include this API call directly in your Airflow dag to trigger validation right after a load completes:
Chain this operator after your load task:
to ensure that quality checks run immediately after data load, enabling faster issue detection and downstream notification.
<database>.<schema>.<table> since the default database and schema might not be set.