Astro Observe data quality helps you monitor tables to ensure data accuracy, completeness, and integrity across your pipelines. It automatically tracks key metrics such as column null percentages, schema changes, and table row counts to detect anomalies or unexpected shifts in your data.
Before connecting to Astro Observe, configure the necessary permissions for your data platform.
For Snowflake connections, the Observe role must have access to both the ACCOUNT_USAGE and INFORMATION_SCHEMA system tables. The service user must have a default warehouse configured to support discovery and ongoing data quality monitoring.
Astronomer recommends key-pair authentication for Snowflake service users. Generate an RSA key pair, then assign the public key to the Observe service user to enable secure authentication.
All Snowflake integrations require that the Observe role has access to both ACCOUNT_USAGE and INFORMATION_SCHEMA system tables. The service user must have a default warehouse configured for all discovery and monitoring operations.
After you configure permissions for your data platform, create an Observe connection.
Complete the following fields:
FY02423-GP2141). Observe maps assets to a connection by account identifier.ASTRO_OBSERVE_USER).Only one Observe connection is allowed per Snowflake account identifier. If you have multiple Snowflake accounts, create a separate connection for each account identifier.
Navigate to Asset Catalog, filter by your data platform (for example, Snowflake tables or Databricks tables), and select the desired table.
You can sort tables by popularity to quickly identify frequently used tables. Popularity rankings are based on query frequency and the number of unique users accessing each table.
The Schema tab shows table structure details:
You can enable monitoring for specific columns to actively track completeness.
The Event Timeline tab shows data quality events for a selected timeframe. Events are color-coded by severity: Success, Neutral, and Failure. Click an event to view details, historical patterns, and affected metrics.
The data quality tab provides visualizations for monitored metrics:
To create and manage data quality monitors, see Monitors in Astro Observe.
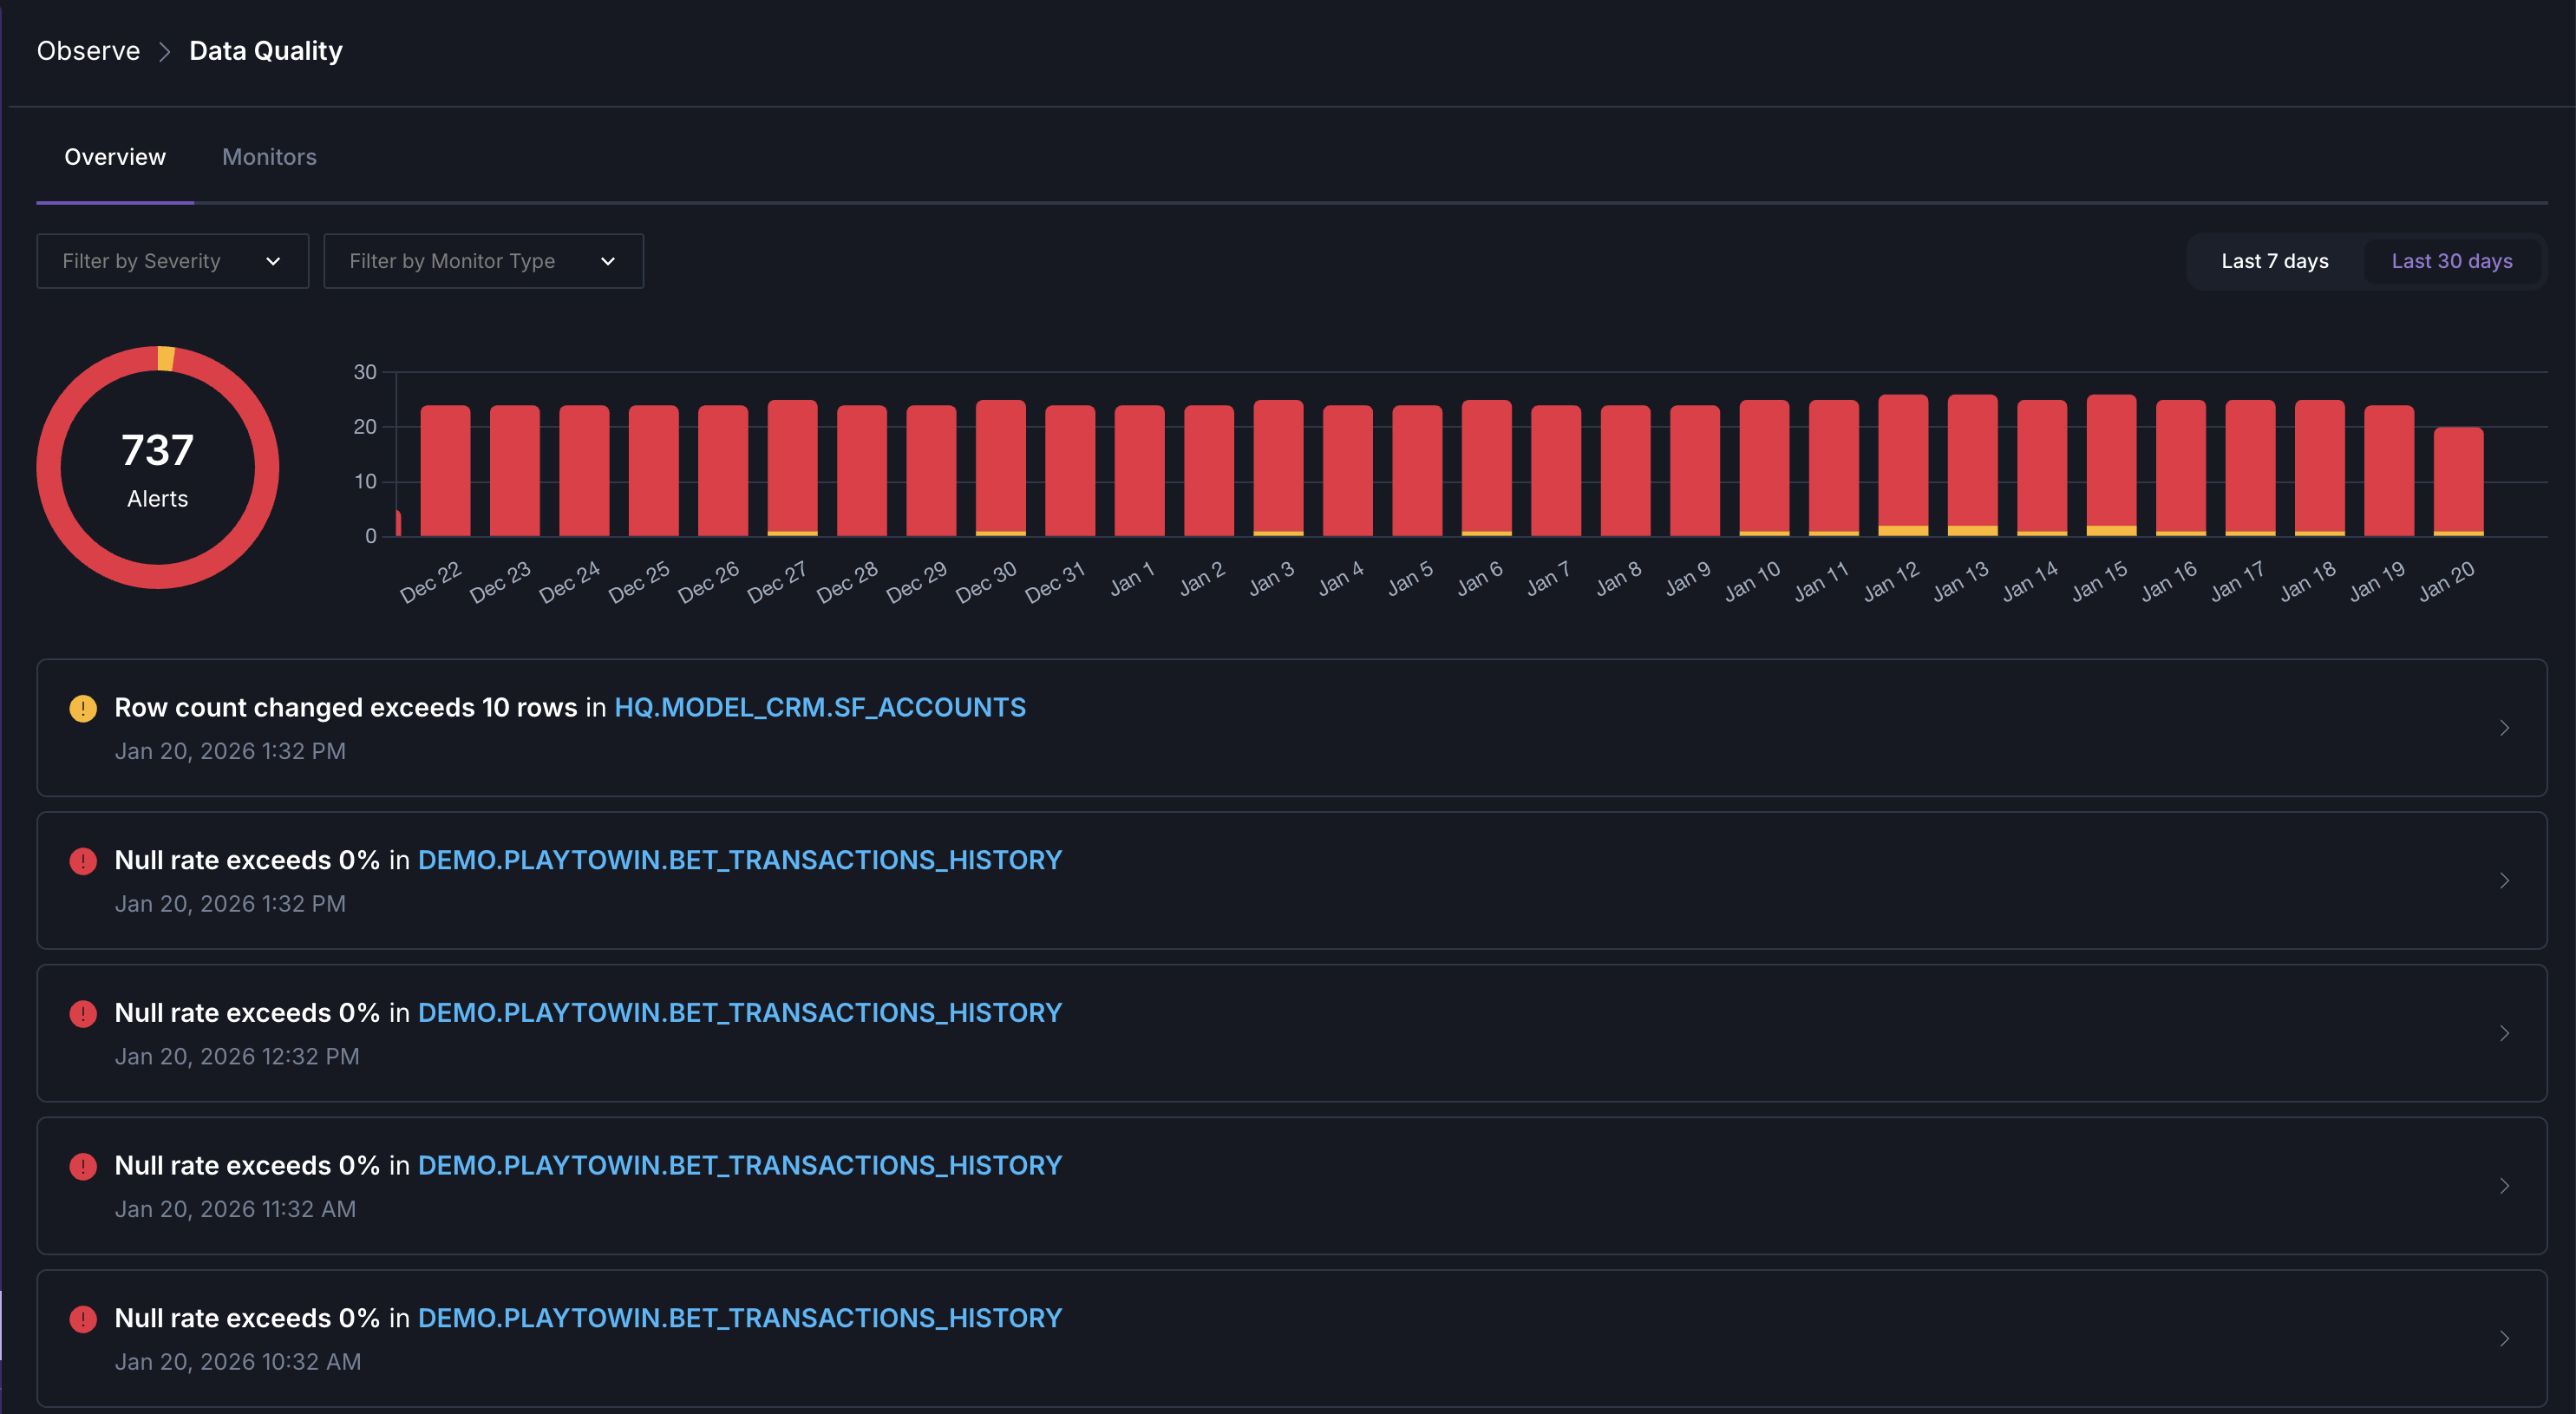
To see a high-level overview of your organization’s data quality, click Data Quality in the navigation. Here you can see a summary of triggered data quality monitors from the last week or month, grouped by severity and check type.
Click any triggered monitor to investigate it and see the underlying data that triggered the monitor’s conditions.