

In Observe, a data product is a composition of assets that deliver a result with business relevance. Observe automatically infers upstream dependencies for the assets that define a data product, like an Airflow dag that populates a dashboard or a Snowflake table powering a recommendation engine.
For guidance on identifying data products in your organization, see how to identify data products in your organization.
The Data Products landing page provides an overview of all your data products and their SLA statuses. You can see at a glance which data products are late or stale, who owns them, and when they were last updated to see a snapshot of data product health.
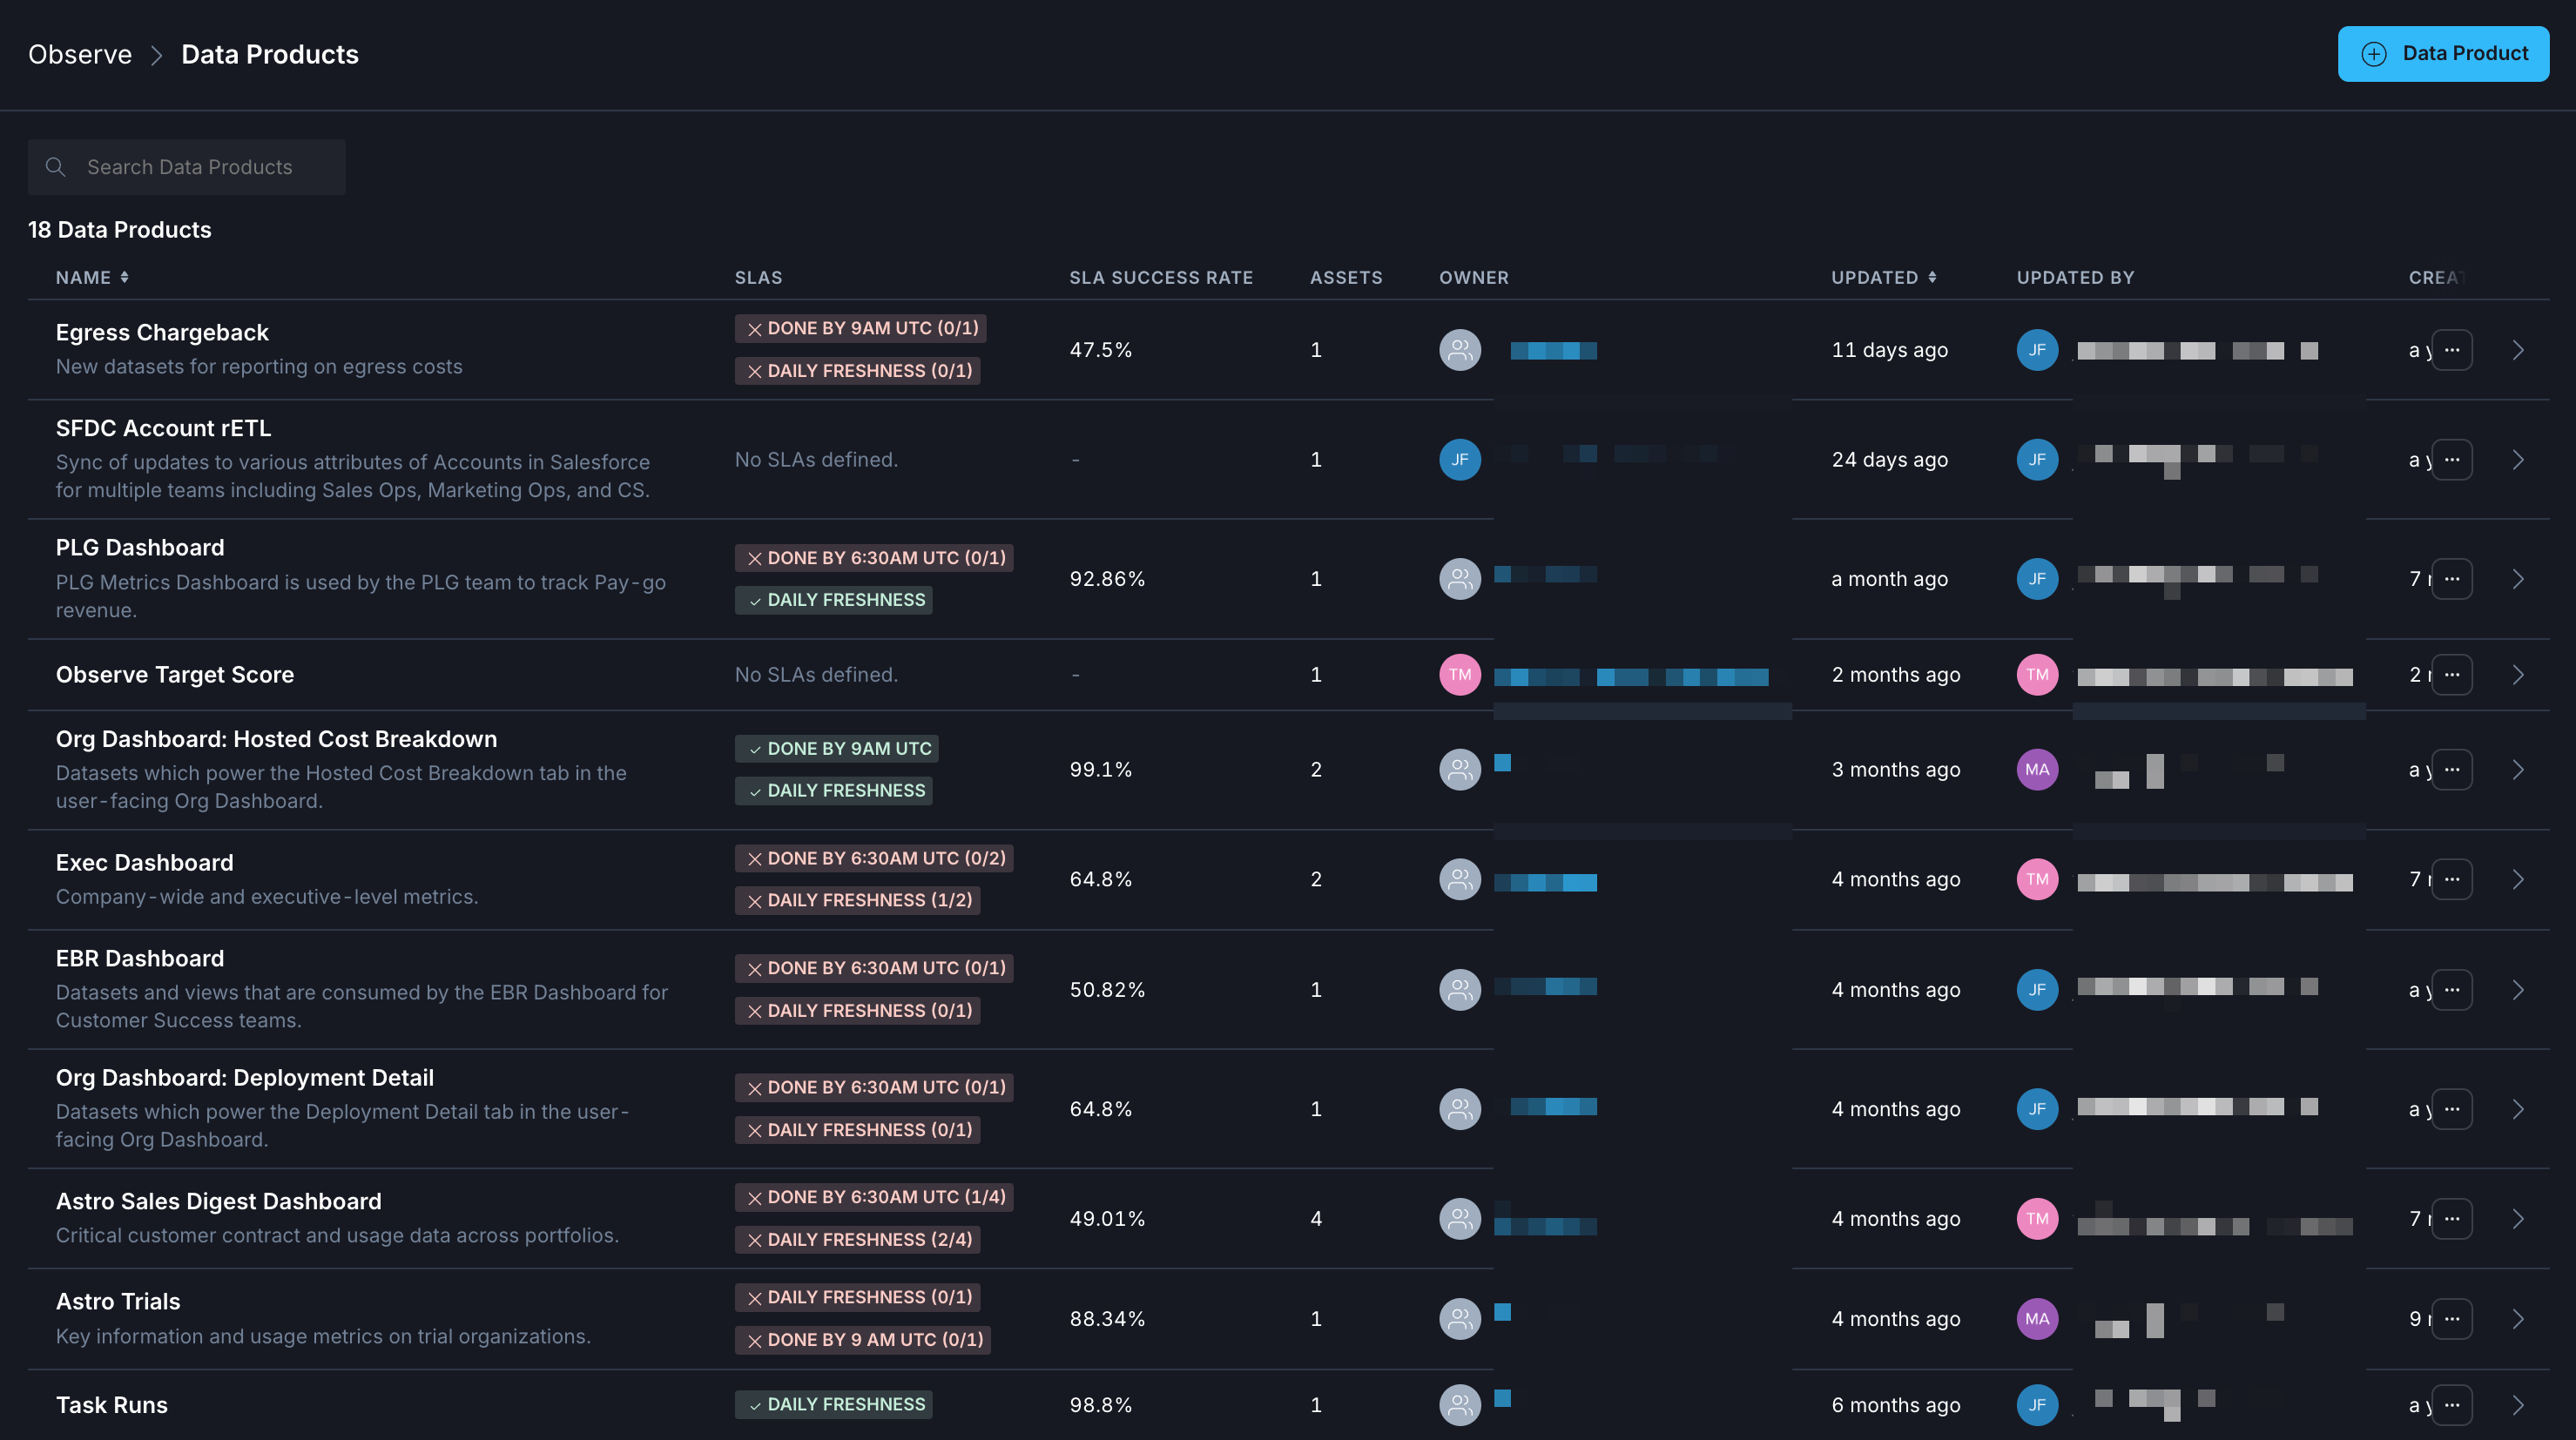
The following procedures describe how to create data products and leverage them to gain insight across pipelines and deployments. After you create a data product, then you can view data product details.
See Create a data product monitor for information on monitoring data products.
After completing these steps, your new data product will be available to view and manage under Data Products.
After you create a data product, you can view in-depth details about the performance of your assets by selecting your data product for a closer look.
Click Observe in the Astro UI, and then click Data Products.
Choose the data product that you want to view details about.
When you see information about a specific data product, you can see summary performance data. This includes general statistics, like the average SLA success rate and information about when the data product was created and last updated. Additional details can be found in the following tabs.
The overview tab provides summary information about the assets in your data product and the rates of overall SLA success rates, consolidated into daily, weekly, and monthly overall rates. This view allows you to quickly identify trends in historical data for your business-critical pipelines.
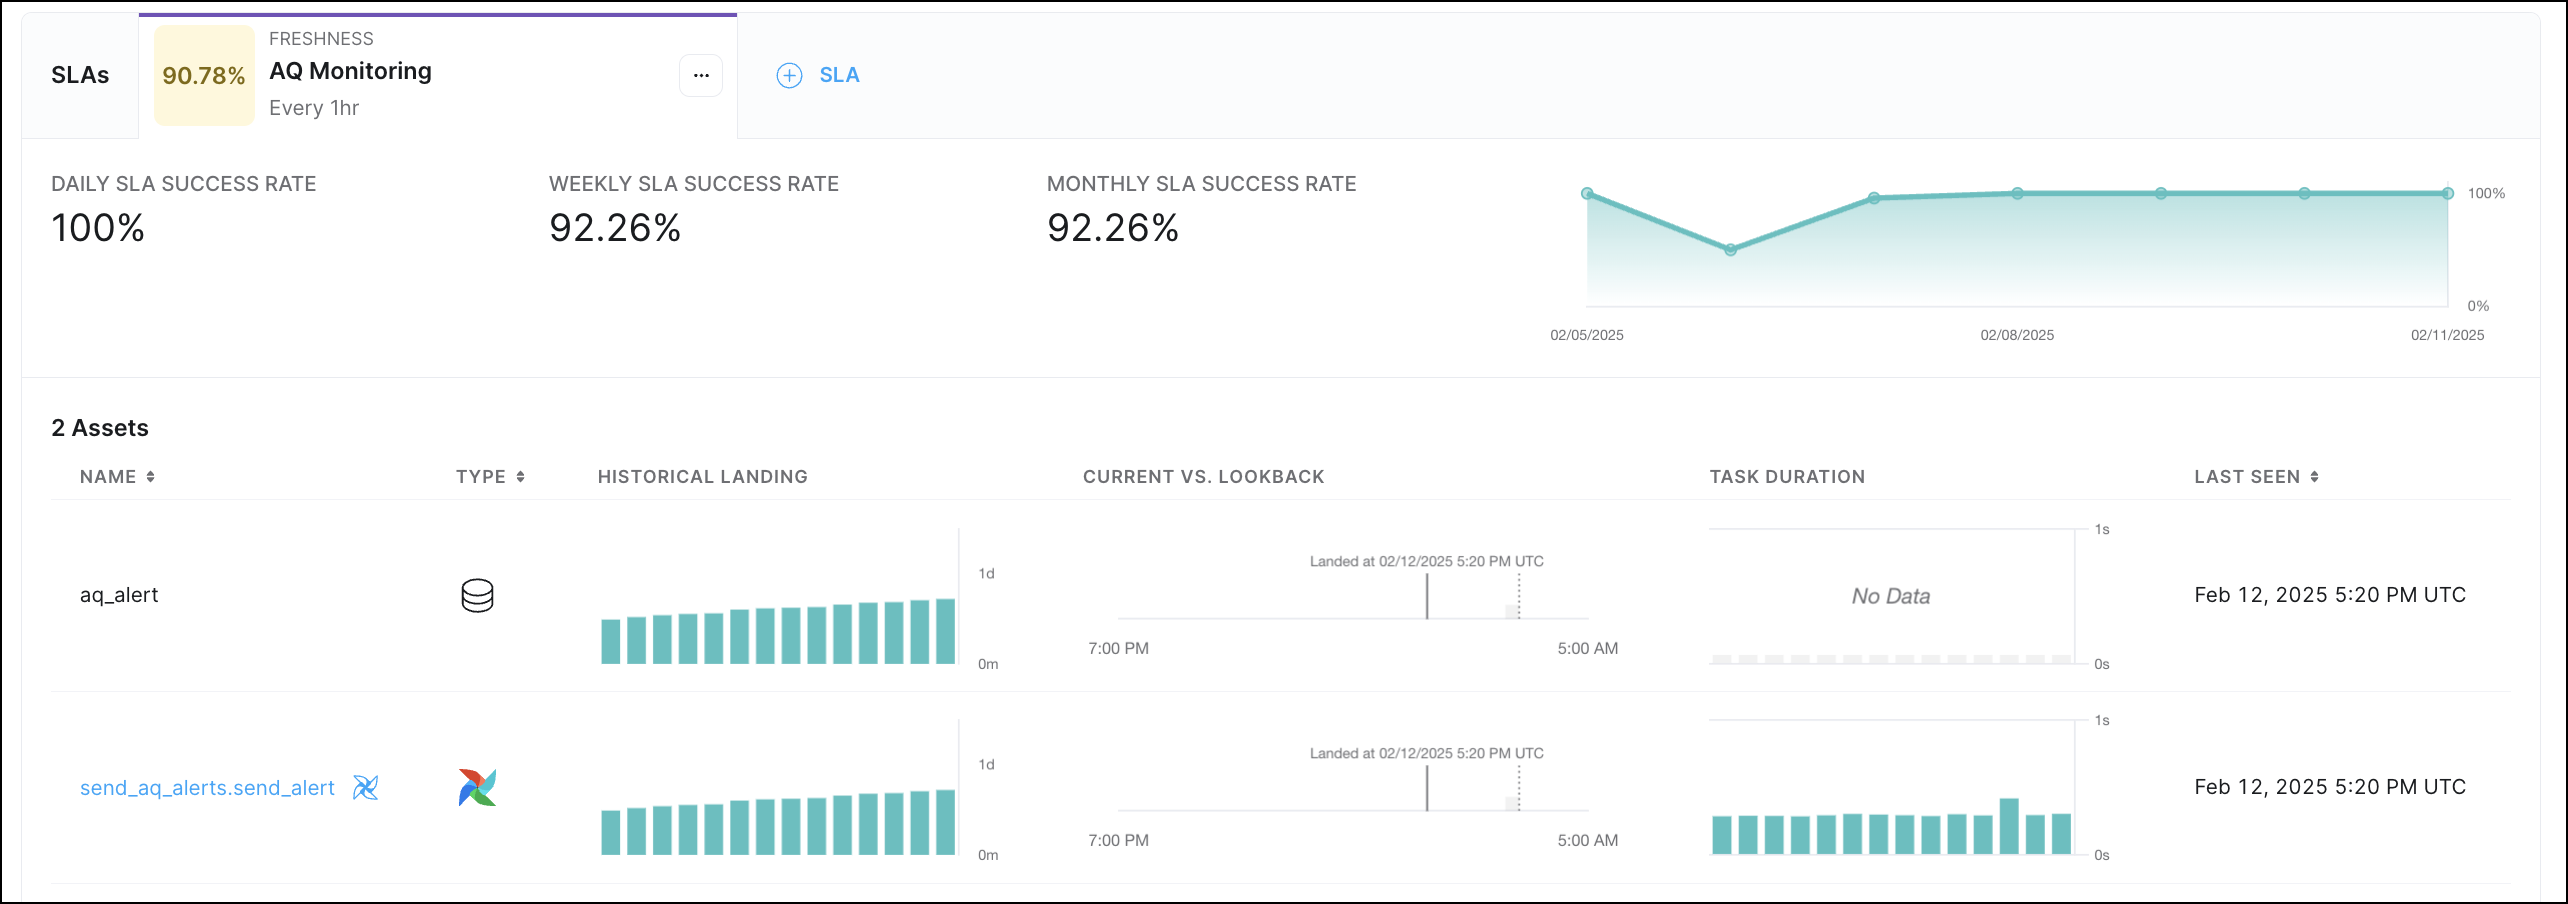
Each Data Product in Observe has an Event Timeline that reflects activity from the assets, like dag and task completion, and key issues, like breached SLAs and triggered alerts, in that data product. The event timeline supports filtering by event status along with more fine-grained filters. Selecting any particular event displays metadata about the event, including the notification history of a triggered alert.
The event timeline view allows you to see a record of events associated with your data product. These are categorized into Success, Neutral, and Failure events.
For more information about diagnosing failures, see Root cause analysis and AI log summaries.
The Assets tab shows the assets included in the specific data product.
If you select an asset from the list to examine in-depth, you can see additional asset-specific details. See Assets for descriptions.
Data products that include Airflow task assets report the following metrics by default:
The Alerts tab consolidates all alerts and SLAs that are specific to your selected data product. From this page you can Add an alert, find an existing alert, and view the notification history for an alert.